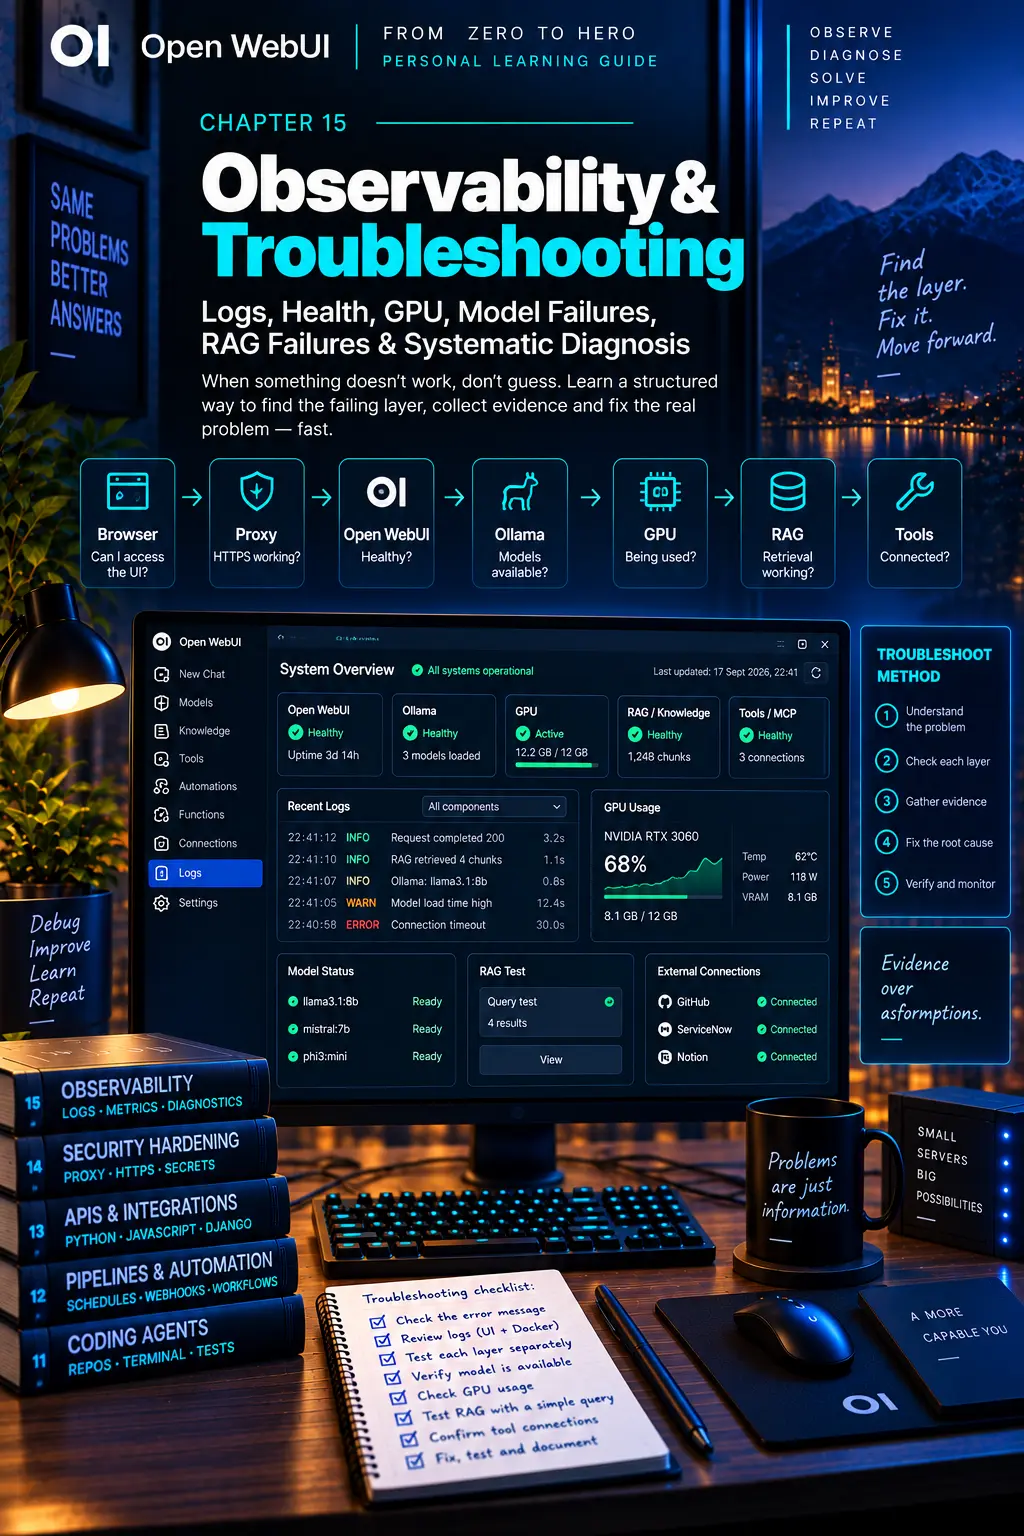
CHAPTER 15
Observability & Troubleshooting
Diagnose the stack without collecting random fixes.
On this page
Faithful English web edition · Original chapter, structure and illustrations from the learning guide.
LEARNING OBJECTIVES
Diagnose the first broken boundary
You will turn a vague failure into a reproducible symptom, move through a layered diagnostic ladder, collect useful logs, separate GPU and context problems, trace RAG as a pipeline and write an incident record another operator can follow.
01. Troubleshooting is a method
 Enlarge illustration ↗
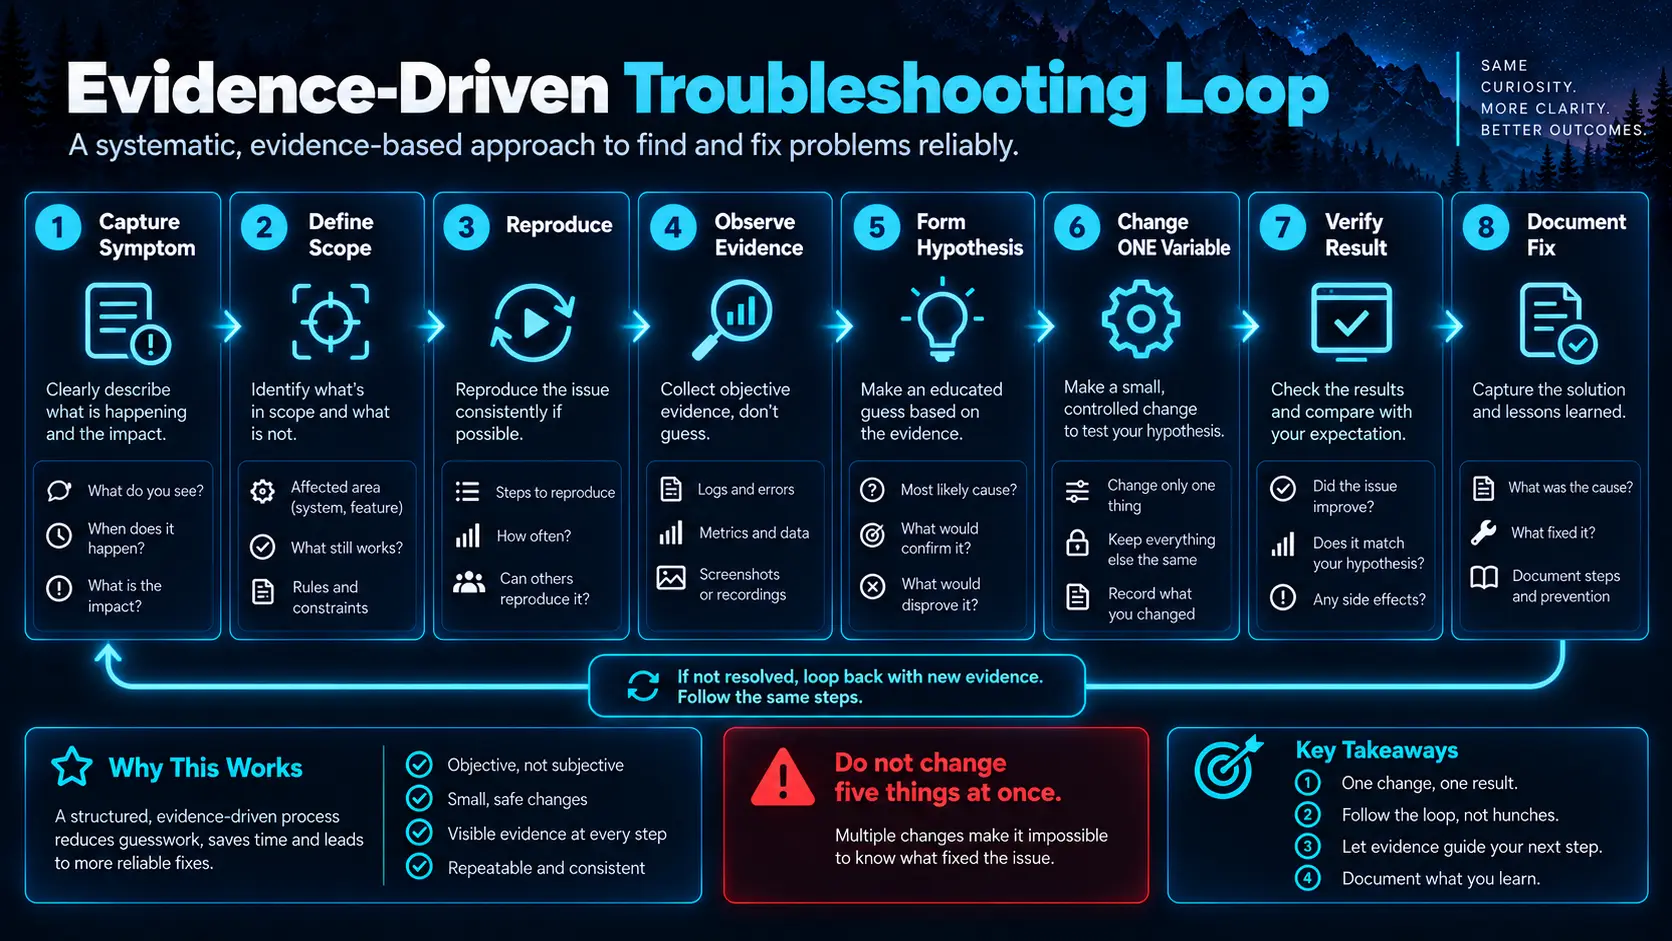
Random changes erase evidence. Begin with the exact time, user, URL, model, input, expected result, observed result and error. Determine scope: one browser, one user, one model, one provider, one document or the whole service.
Reproduce before changing anything. A repeatable failure is a controlled experiment; an intermittent one needs timestamps and conditions. Change one variable, run the same reproduction and record the result.
02. The diagnostic ladder
 Enlarge illustration ↗
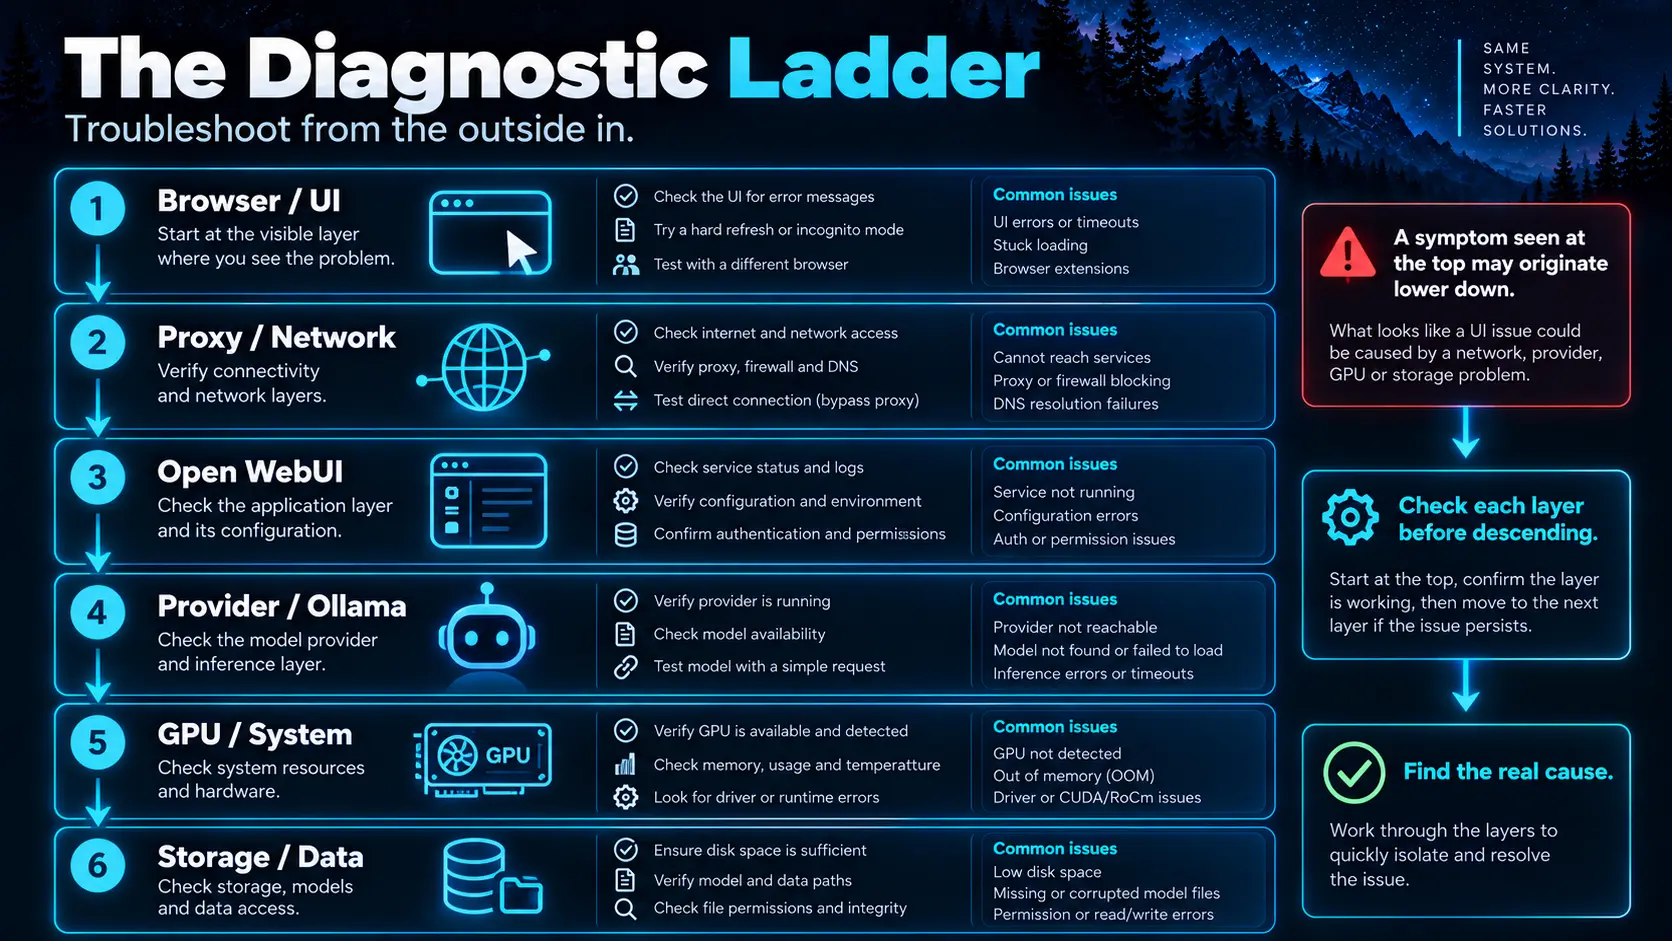
- Browser/UI: console, request, response and account.
- Proxy/network: routing, TLS, streaming and reachability.
- Open WebUI: health, logs, permissions and configuration.
- Provider/Ollama: direct model list and minimal generation.
- GPU/system: VRAM, offload, disk and process pressure.
- Storage/data: permissions, database, extraction and vector state.
“Everything is broken” becomes useful only after you identify the first boundary that does not satisfy its contract.
03. Healthy means usable
A process can be running while its model provider or retrieval path is failing. Use three levels:
- Liveness
- The Open WebUI process responds.
- Connectivity
- The application can reach and enumerate the configured provider.
- Deep check
- A controlled prompt completes through the real path, optionally including retrieval or one Tool.
Keep the deep check small and predictable. It should prove service, not consume production-scale inference.
Run probes from the same route as their consumer. A host-level curl can pass while the container network fails; an internal URL can pass while the public HTTPS proxy is broken. Label each probe with the boundary it proves.
04. Logs are evidence, not decoration
The browser console exposes frontend exceptions, blocked requests and CORS. Proxy logs show public status and upstream timing. Container logs show application exceptions; provider logs show model load and inference failures.
docker compose ps
docker compose logs --since=15m open-webui
docker compose logs --since=15m ollama
Use the least verbose log level that captures the event, raising it temporarily for a reproduction. Structured JSON helps central processing. Audit logs answer who changed what; operational logs answer why a request failed. Neither should contain raw secrets.
Align clocks and timezones before correlating sources. A browser timestamp, proxy access line and provider error that appear several minutes apart may describe the same request if one component logs UTC and another local time.
05. Containers and deployed reality
docker compose ps
docker inspect open-webui --format '{{json .State}}'
docker inspect open-webui --format '{{json .Config.Env}}'
Restart loops often follow invalid configuration, a missing mount, failed migration or resource pressure. Verify the actual container environment, image tag, networks, mounts and command — not the Compose file you believe was deployed. Redact credentials before sharing output.
Do not begin with restart. Capture exit code, previous logs and resource state first. A restart may temporarily remove the symptom while destroying the evidence needed to explain it.
06. Ollama and model connectivity
 Enlarge illustration ↗
curl http://ollama:11434/api/tags
curl http://ollama:11434/api/generate \
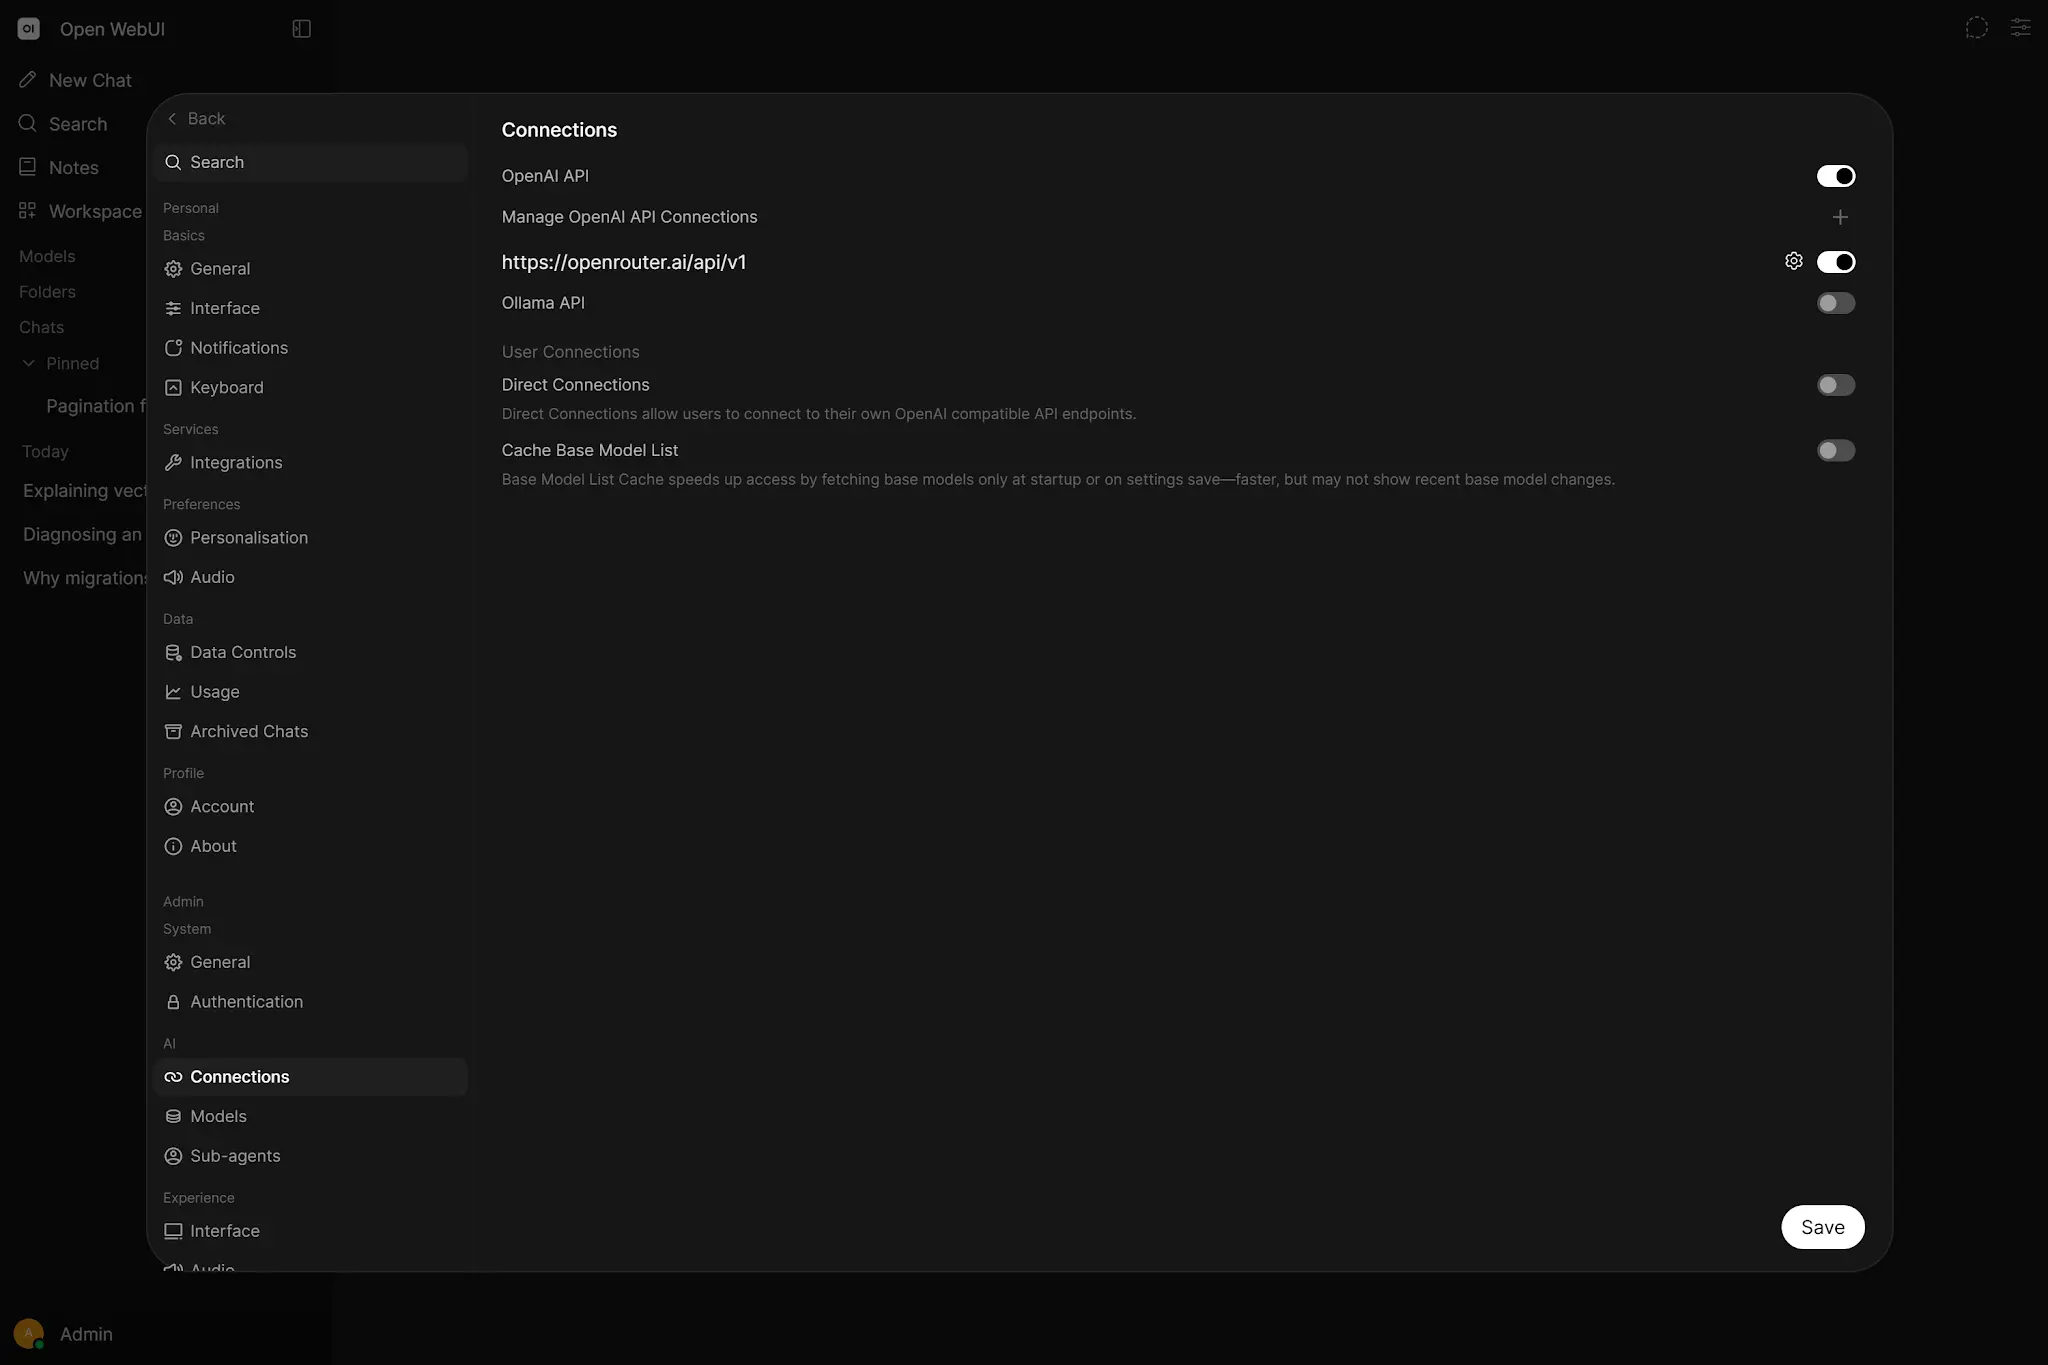
-d '{"model":"<MODEL>","prompt":"Reply with OK","stream":false}'Test the provider from the same network context as Open WebUI. localhost inside one container does not mean another container or the host. If models disappear intermittently, correlate provider restarts, network errors, configuration changes and UI cache rather than repeatedly deleting connections.
Use the smallest direct generation that still loads the failing model. If direct generation succeeds but Open WebUI fails, the fault lies above the provider: identity, model mapping, connection configuration or request enrichment.
07. GPU, VRAM, context and slow models
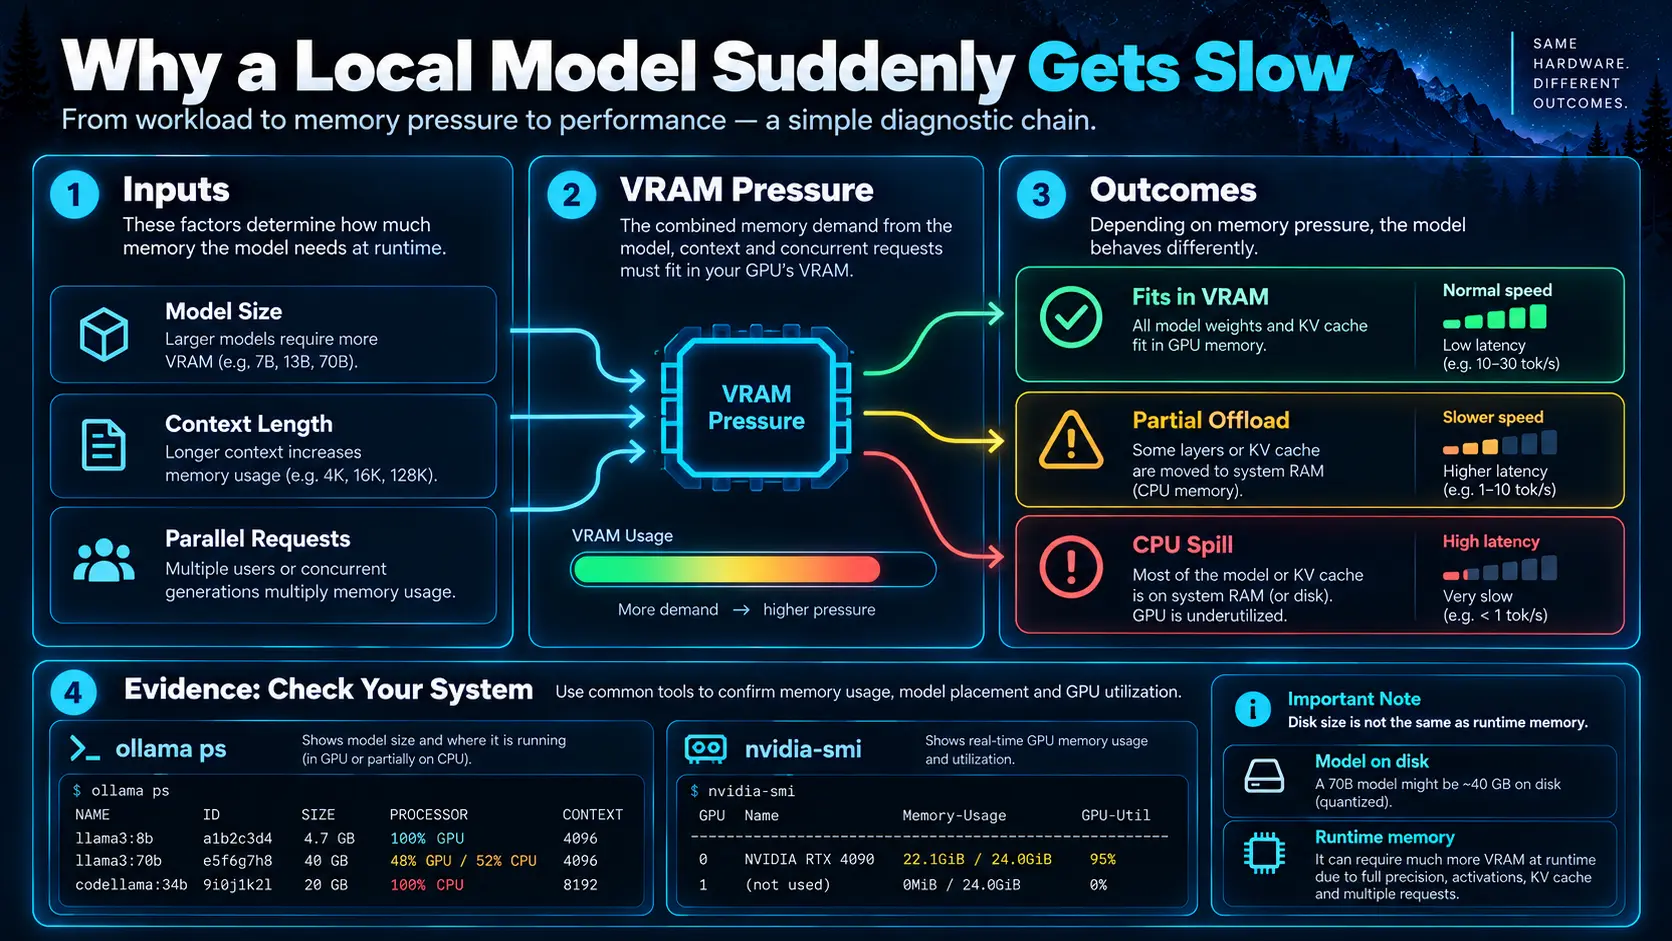 Enlarge illustration ↗
ollama ps
nvidia-smiollama ps identifies loaded models, context and processor split. A model partly offloaded to CPU can fit yet run slowly. Longer context expands KV-cache pressure; parallel requests multiply memory use. Disk size describes stored weights, not the entire runtime footprint.
nvidia-smi is supporting evidence: GPU memory, utilisation and competing processes. Compare it with provider state and the exact request rather than treating one number as the diagnosis.
08. Prompt and context failures
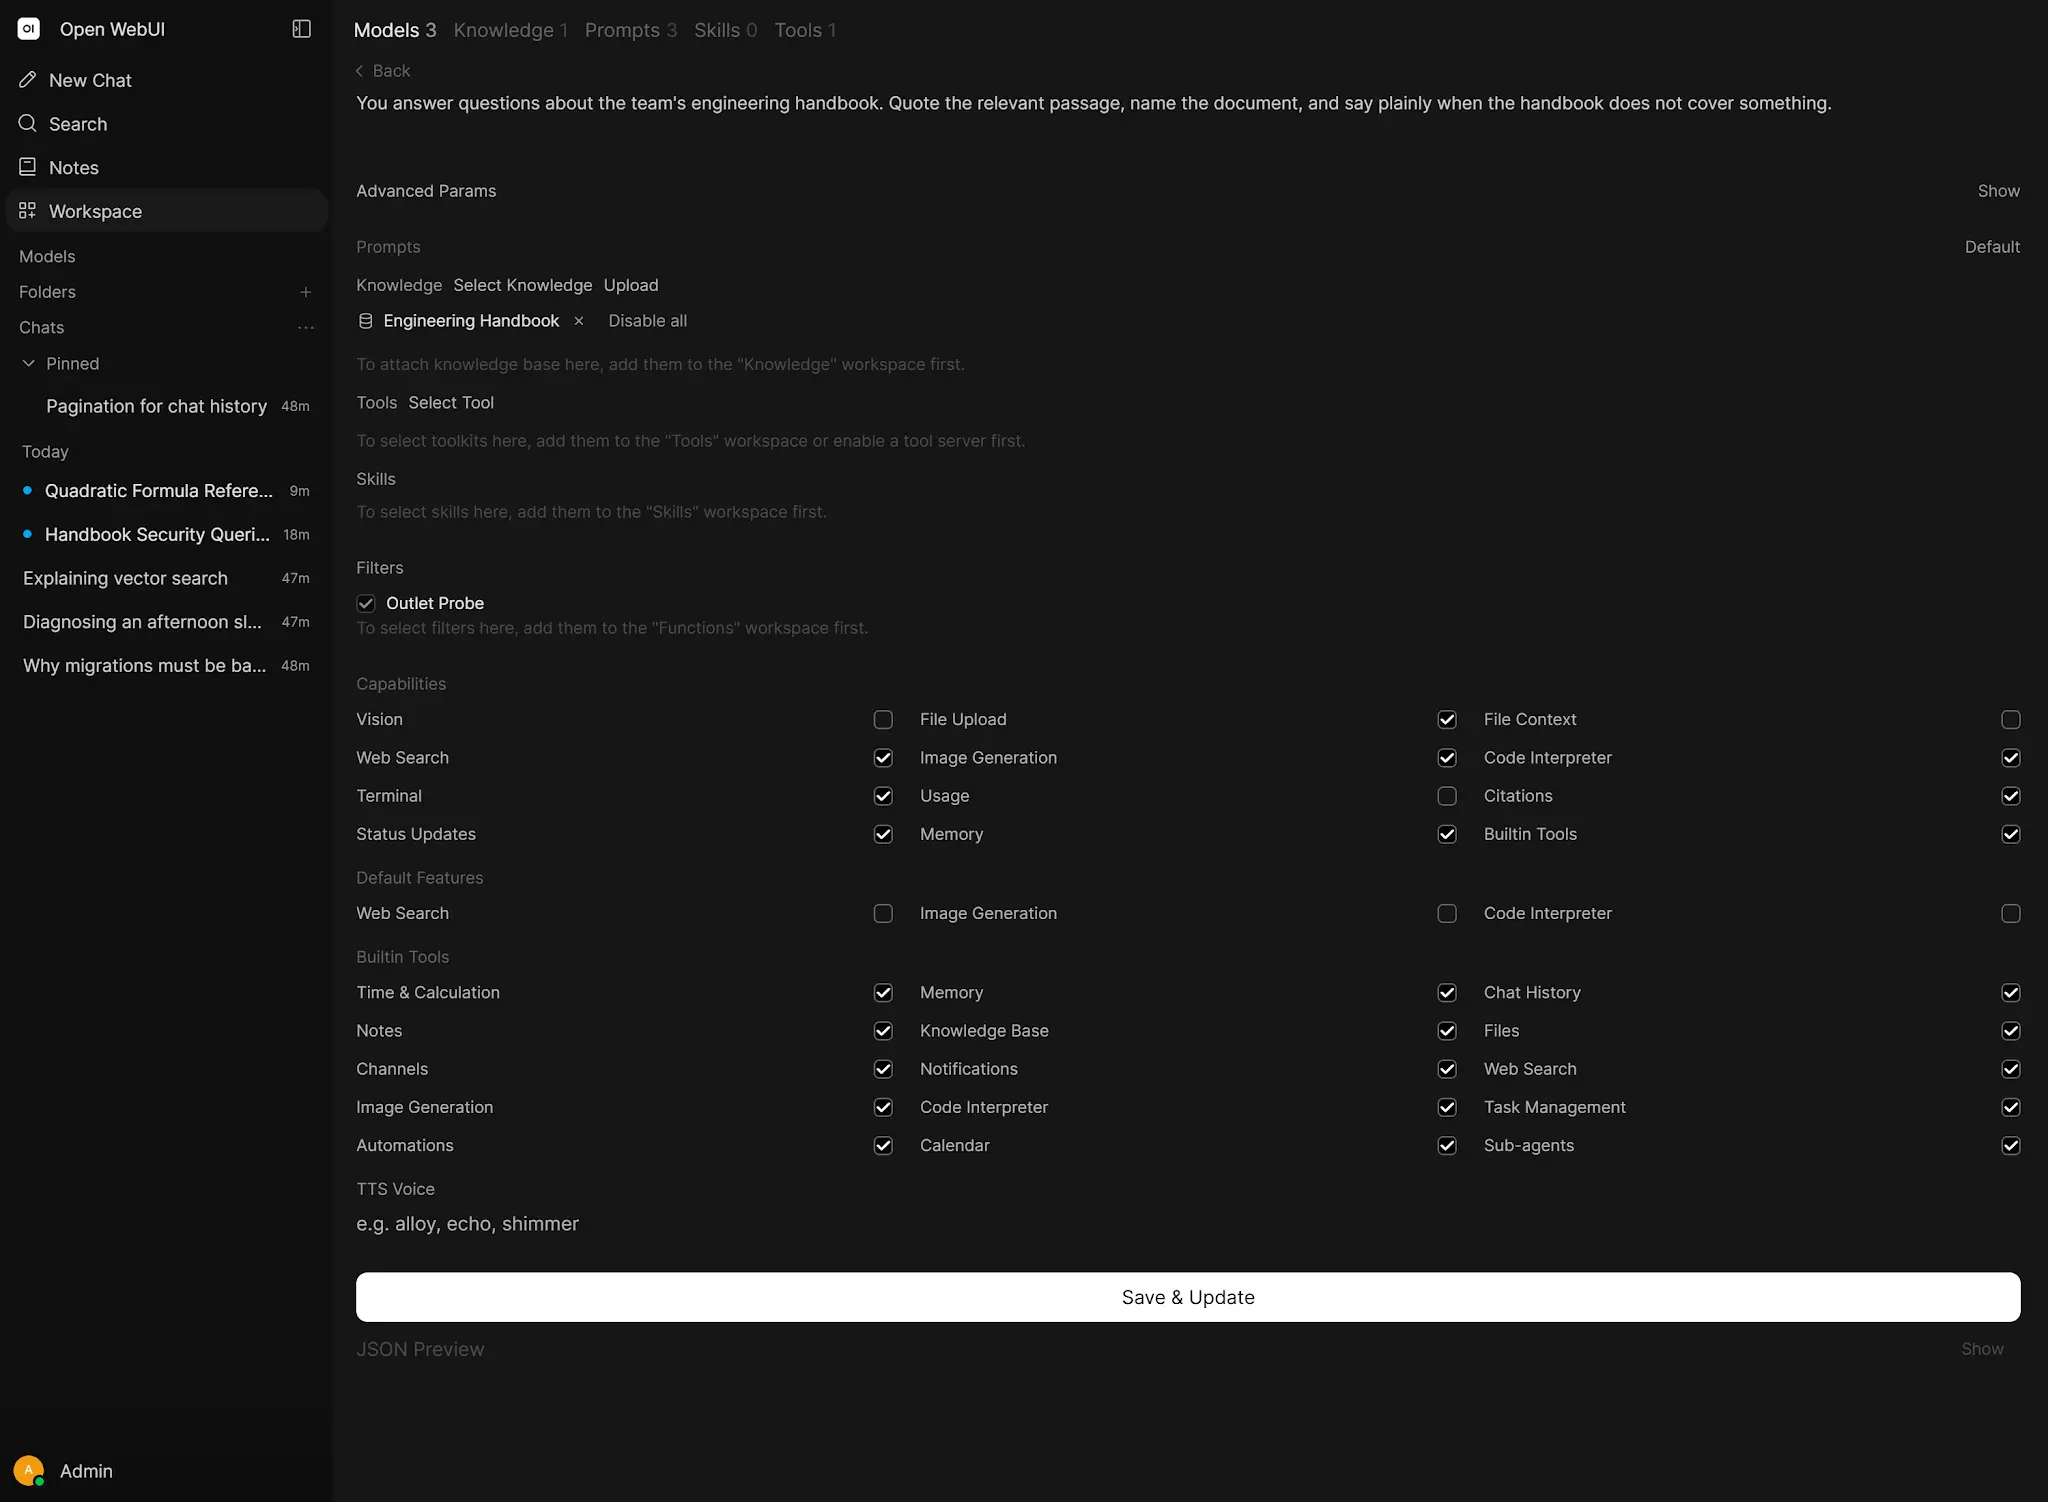 Enlarge illustration ↗
System prompt, conversation history, retrieved chunks, tool schemas and the planned answer all share the context budget. An oversized request may fail explicitly, become slow, lose older instructions or leave too little room for useful generation.
When follow-ups degrade, test the same question in a new chat. Compare the Workspace Model, per-model defaults and provider context settings. This separates accumulated history from a general model problem.
09. Debug RAG as a pipeline
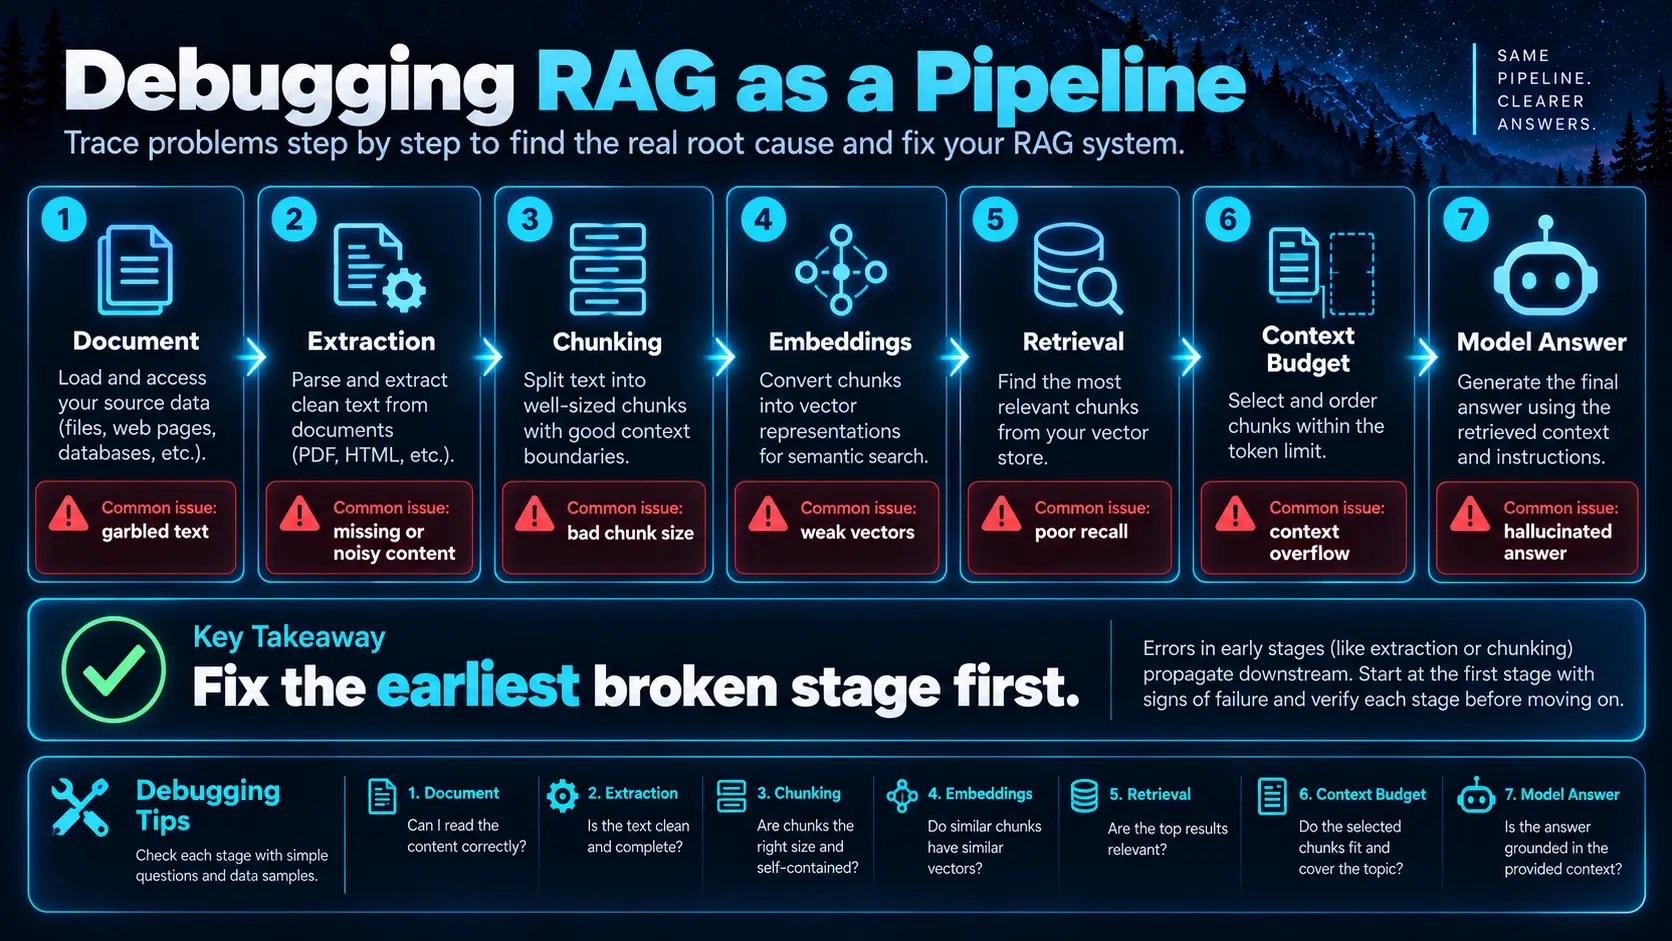 Enlarge illustration ↗
- Extraction: is the expected text present?
- Chunking: are related facts kept together with useful metadata?
- Embeddings: did the model load and index complete?
- Retrieval: does the known question return the known passage?
- Context assembly: did that passage fit into the prompt?
- Generation: did the model follow evidence and citation instructions?
 Enlarge illustration ↗
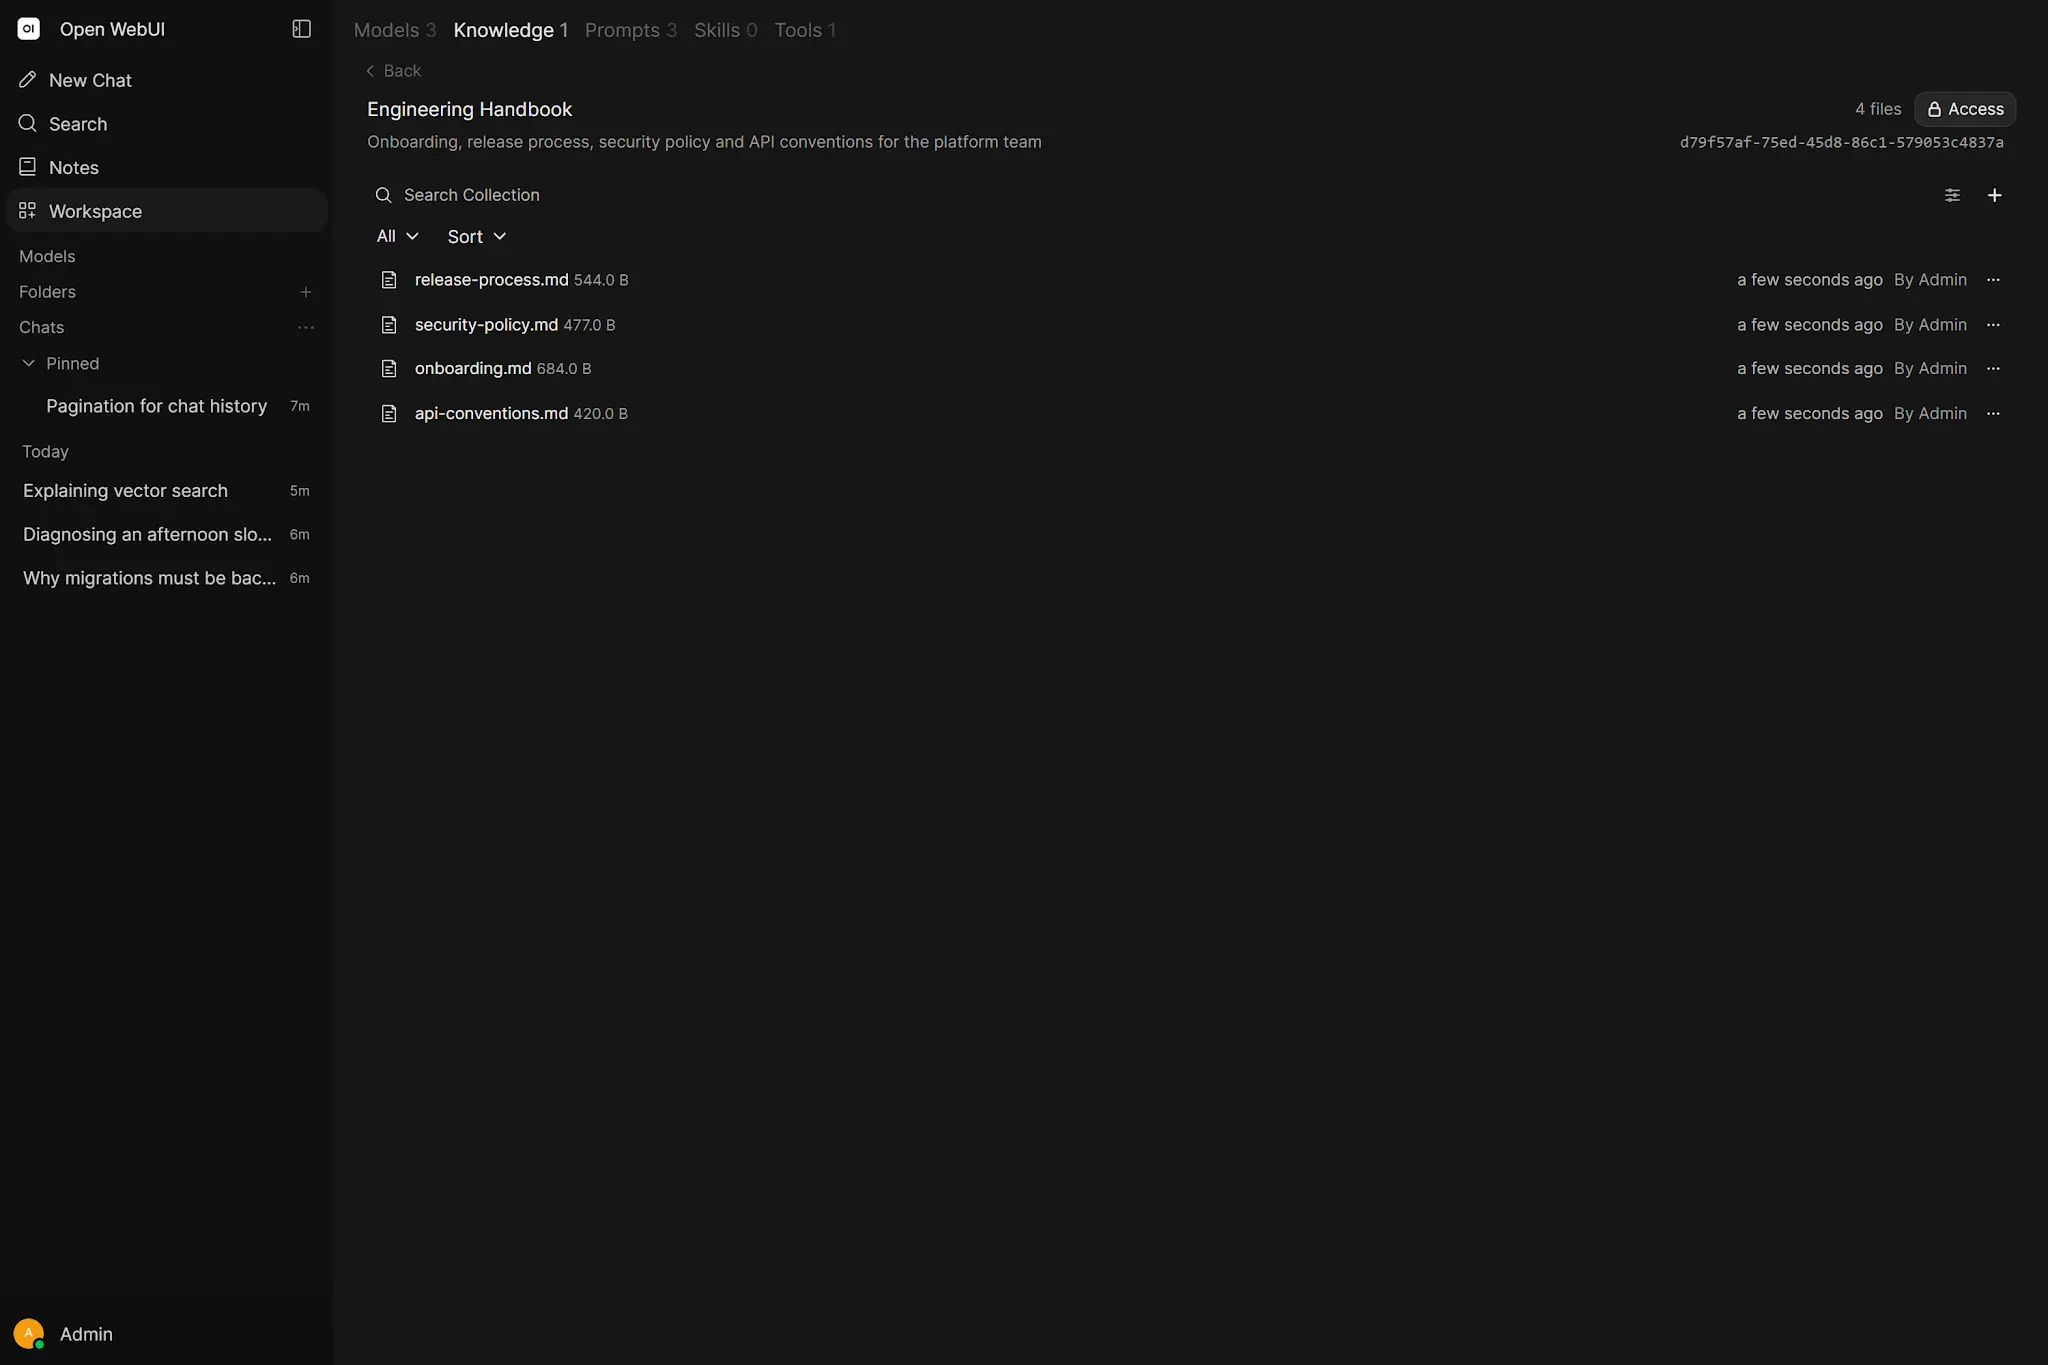
A fluent answer is not proof of retrieval. Verify sources. If retrieval fails, changing the generator’s temperature cannot repair it.
Keep one golden document and question whose supporting sentence is known. Run it after extractor, embedding-model, chunking or reranker changes. Without a fixed case, each new test introduces new uncertainty.
10. Tools, MCP and authentication
Separate connection from intelligence. First invoke the service directly with known arguments. Then test the Open WebUI connection and authentication. Only after both work should you evaluate whether the model chooses the Tool correctly.
- Test from Open WebUI’s network namespace.
- Verify API token, OAuth owner and expiry.
- Inspect Tool name, description and schema.
- Use a model capable of reliable tool calling.
- Make the prompt’s need for the Tool explicit during diagnosis.
 Enlarge illustration ↗
11. Browser, proxy, CORS and streaming failures
If the shell request works but the browser does not, inspect the browser’s network panel and console. A UI that loads while generation never appears often points to buffering, SSE/WebSocket forwarding, timeout or mixed-content policy at the proxy.
A CORS error is a browser origin decision, not a generic network failure. Compare scheme, host and port exactly. Test both the canonical proxy URL and the internal direct route to identify which boundary introduces the failure, but do not leave the direct route exposed afterwards.
12. Database, storage and uploads
 Enlarge illustration ↗
df -h
df -i
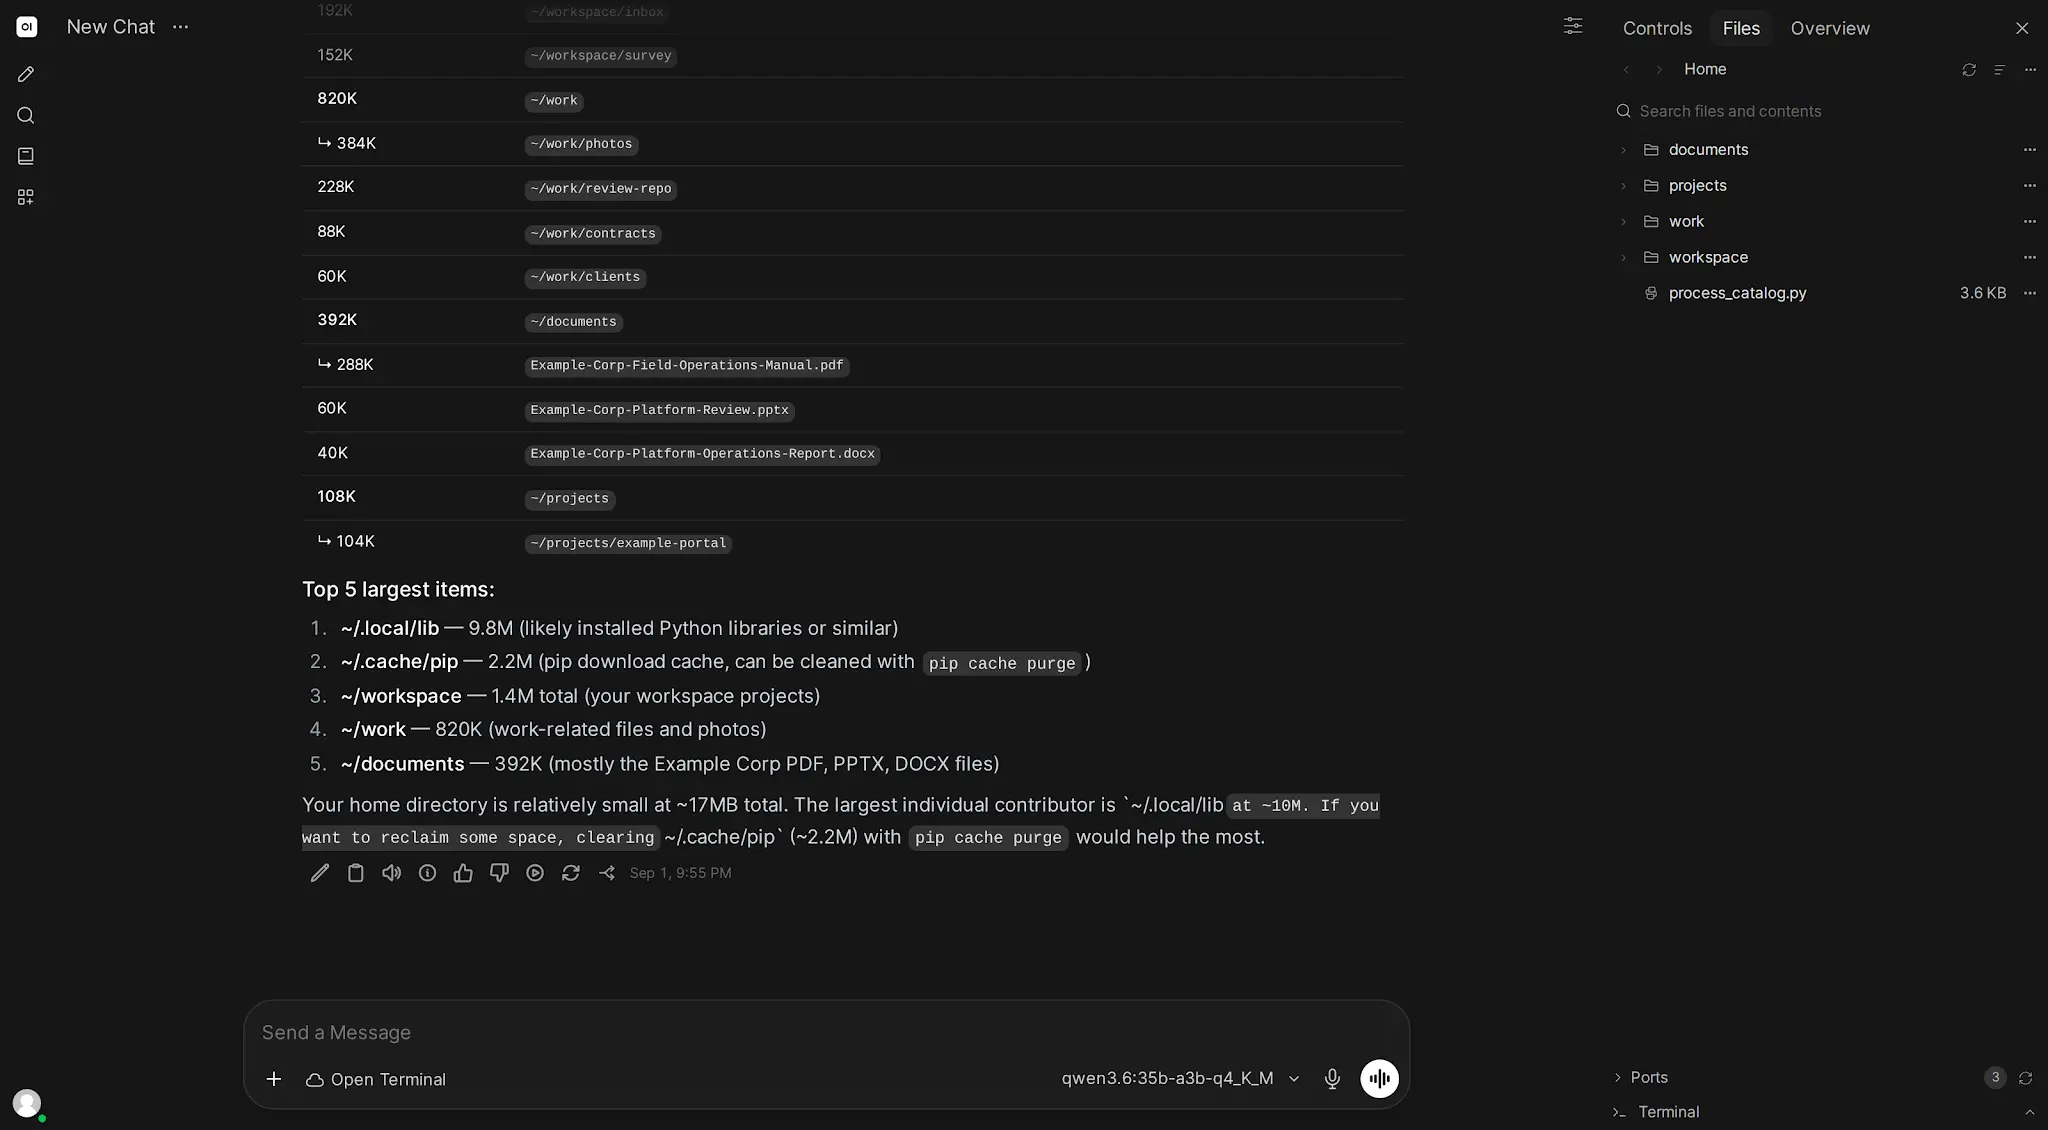
docker inspect open-webui --format '{{json .Mounts}}'Check free bytes and inodes, volume ownership and write permission. Multiple application workers require compatible shared state; local vector-store assumptions may not hold across workers. Large document ingestion can spike memory and temporary disk even when steady-state usage looks safe.
13. Read the shape of slowness
| Observed shape | Likely investigation |
|---|---|
| Slow first token, then fast | Cold model load, prompt processing, retrieval or queue time. |
| Every token slow | CPU offload, model size, quantisation, GPU saturation. |
| Fast for one user, poor under load | Concurrency, VRAM multiplication and queue policy. |
| Only long chats degrade | Context and KV-cache growth. |
Measure time to first token, token rate, total latency, queue time and error rate. One “it feels slow” measurement cannot distinguish them.
14. Monitoring and alerts
Monitor service health, request error rate, latency, restarts, CPU/RAM/GPU, disk, model load failures and retrieval or Tool errors. Alerts need owners and actions. A noisy alert teaches operators to ignore the system; alert on symptoms that require intervention.
Prefer service-level signals over isolated hardware numbers: “deep check failed three times” is more actionable than “GPU reached 95%” during healthy generation. Keep dashboards for investigation and alerts for conditions that demand a response.
15. Repeatable incident checklist
- Record time, account, request and exact symptom.
- Determine scope and recent changes.
- Reproduce with the smallest case.
- Walk the diagnostic ladder.
- Capture relevant logs before restarting.
- State one hypothesis and one change.
- Run the same reproduction.
- Roll back if evidence does not improve.
- Document root cause, fix and prevention.
16. Worked diagnoses
No models appear
Confirm Open WebUI health, inspect the configured provider URL, call /api/tags from the application network and verify permissions. Do not reinstall the UI before testing the provider boundary.
A model suddenly becomes very slow
Record the exact model, prompt and concurrency; inspect ollama ps and GPU state; compare a short fresh chat. Look for context expansion, a second loaded model or CPU offload.
RAG invents an answer that exists in the PDF
Search extracted text, inspect the chunk containing the answer, test retrieval with a known phrase and confirm the chunk entered the final context. Fix the earliest failing stage.
MCP is connected but unused
Call the server directly, verify the user’s auth, inspect schema descriptions, then test a forced simple prompt with one Tool and a capable model.
17. Practical checkpoint
- Write one failure as expected versus observed behaviour.
- Name its scope and the first three ladder checks.
- Capture a correlated browser, Open WebUI and provider timestamp.
- Make one reversible change and repeat the same test.
- Write a short incident note with cause, evidence and prevention.
18. Essential vocabulary
- Liveness
- Proof that a process responds.
- Deep check
- A functional probe that traverses several real layers.
- Reproduction
- The smallest stable sequence that causes a failure.
- Scope
- The users, components or conditions affected.
- Offload
- Running some model work outside the GPU.
- Time to first token
- Delay before the first generated content reaches the user.
- Root cause
- The underlying condition that explains the symptom.
Source and further reading
This edition preserves the chapter's teaching sequence and examples. Screenshots reflect the source edition; controls may move between releases.
Open the original chapter ↗Troubleshooting ↗Logging ↗Monitoring ↗RAG troubleshooting ↗Performance ↗